Trading strategies for family offices to participate in global Forex, financial futures, and commodity markets
NON-CORRELATION
Correlation measures the degree to which two variables move together over time. An investment always has a correlation of 1 with itself. When two investments move perfectly in parallel, they have a correlation of 1. Conversely, investments moving in opposite directions have a negative correlation of -1. The closer the correlation is to 1, the more closely the rates of return will move together. For instance, utility stocks tend to have a high degree of correlation because similar forces influence their stock prices.
In contrast, gold prices are not closely correlated with utility stock prices because they are influenced by different factors. Therefore, when constructing a diversified portfolio, investors typically combine investments with low correlation.
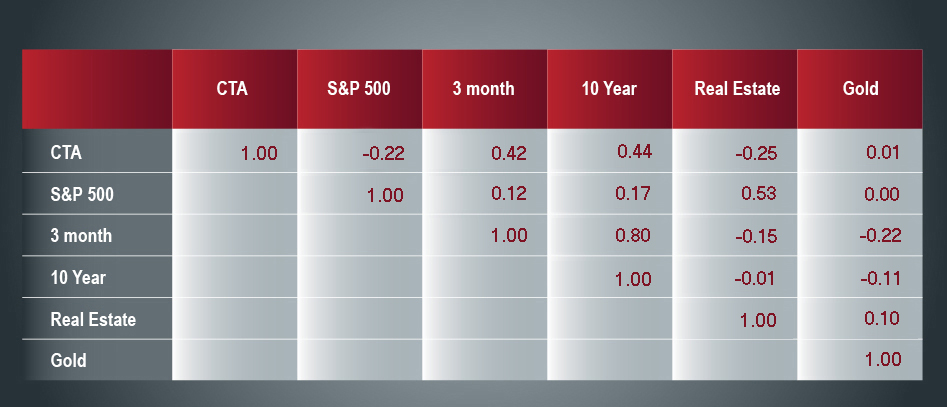
The chart below shows the correlation between various asset classes between 1985 and 2022. The CTA Index has zero or negative correlation with all other asset classes, indicating that it can be a valuable component in a diversified portfolio.
Correlation among Asset Classes

Research has shown that managed futures have a low correlation with both stocks and bonds, making them a useful addition to a diversified portfolio. This is because managed futures traders can easily trade across markets, take both long and short positions, and do not necessarily follow the same trends as stock and bond traders.
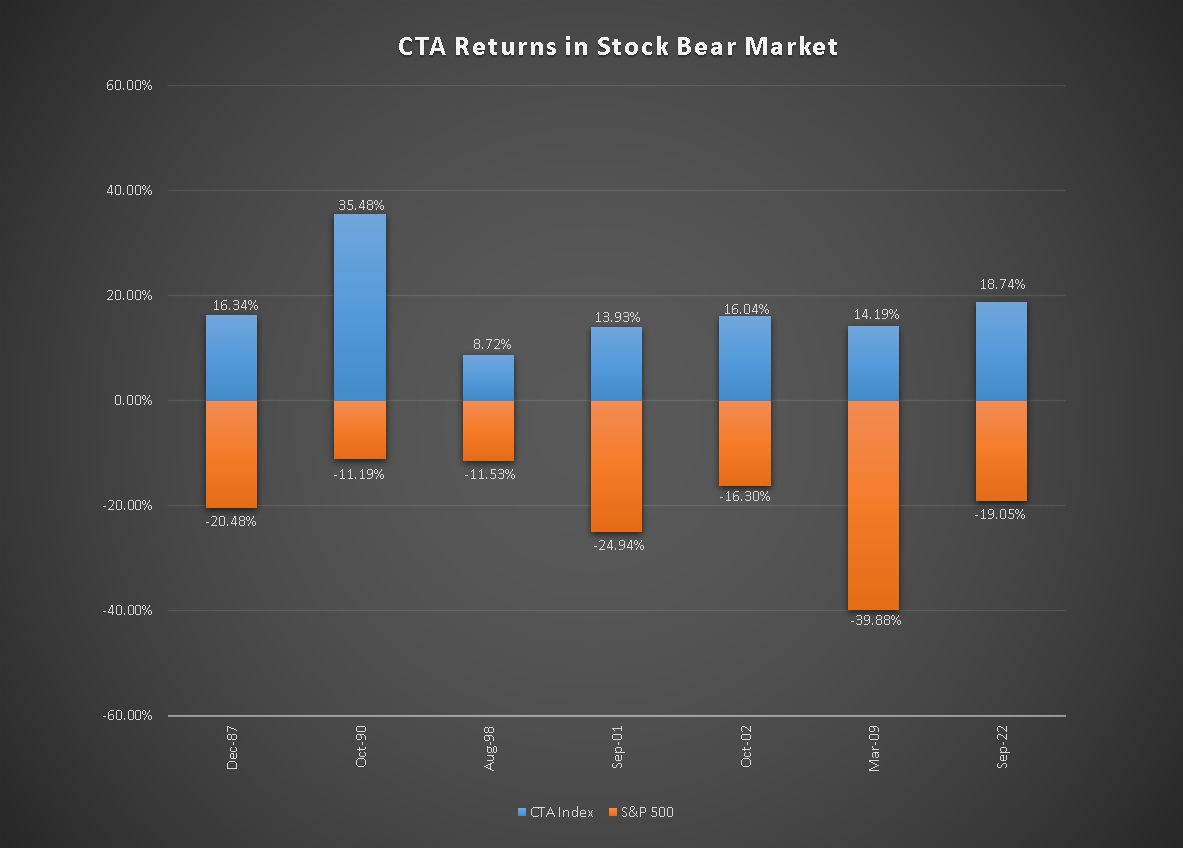
Furthermore, during times of financial stress or market turbulence, managed futures have demonstrated a non-correlated or even negative correlation with stocks. This is illustrated in the following chart.

